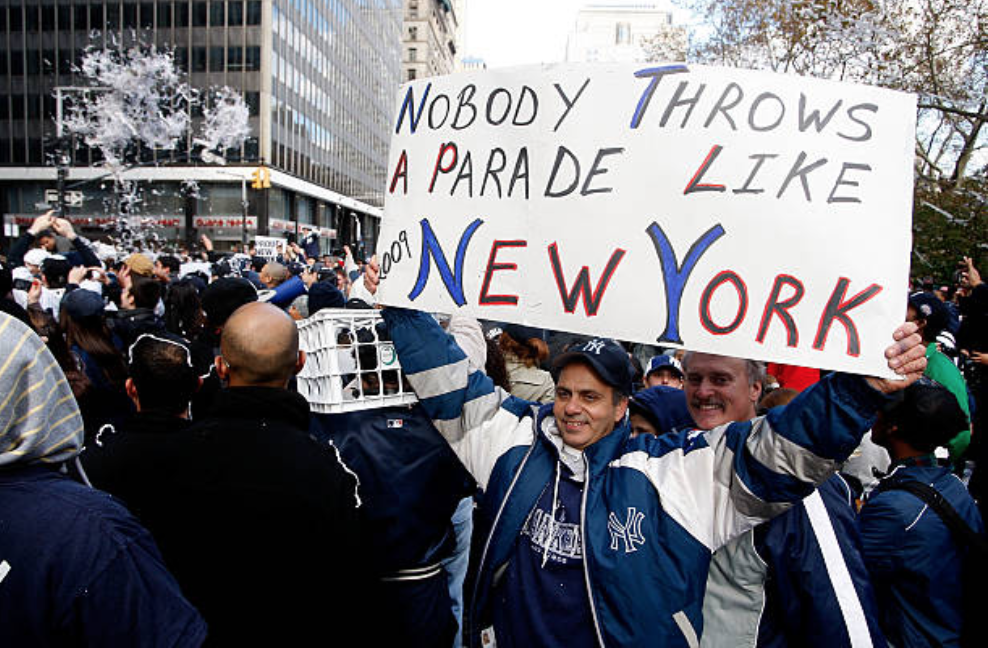
I was thinking about CC Sabathia the other day and remembered his comments from earlier in the season when he said he would likely retire if the Yankees won the World Series this year. That would be his second ring, both with the Yankees. That means none with the Indians or the Brewers. When was the last time there was a parade in Milwaukee or Cleveland (for baseball, that is)? Even though there are some good small market teams, will they actually win over the Yankees, Red Sox, or Dodgers of the world?
Here is a list of the last seven World Series winners, along with their payroll and revenue from that year among other stats courtesy of Forbes:
|
Year |
Team | Payroll | League Average | Payroll Rank | Revenue | Wins-to-Player Cost Ratio |
Portion of franchise’s value attributable to its city and market size (present day) |
|
2011 |
Cardinals | $119,732,312 | $105,749,970 | 9 | $207M | 94 | 37.6% |
|
2012 |
Giants |
$140,482,705 |
$108,429,161 |
7 |
$230M |
80 |
42.3% |
|
2013 |
Red Sox |
$175,344,264 |
$114,612,253 |
3 |
$336M |
48 |
45.0% |
|
2014 |
Giants |
$175,249,982 |
$124,127,912 |
5 |
$316M |
68 |
42.3% |
|
2015 |
Royals |
$132,090,935 |
$136,432,774 |
13 |
$231M |
145 |
28.8% |
|
2016 |
Cubs |
$188,402,394 |
$145,172,879 |
5 |
$340M |
111 |
43.3% |
| 2017 | Astros | $149,964,177 | $152,119,081 | 15 | $299M | 116 |
42.4% |
As you can see, each of the last seven champions has had a payroll in the top half of the league, with only the 2015 Royals being slightly under the league average. The wins-to-player cost ratio describes the number of wins per player payroll relative to the rest of the league, where playoff wins count twice as much as regular season wins. For example, the 2017 Astros achieved approximately 16 percent more than the league average.
Lastly, the end column essentially depicts how much the market in which the team plays influences their total value. From this, it can be seen that the Royals typically are a smaller market team, whereas the Red Sox reside in a much larger market. The Yankees currently rank second in the league behind the Dodgers in this category at 48.1 percent (Yankees are deemed the best value team, however), but the lowest rank among the above six teams belongs to the Royals, who are twenty-seventh. For comparison purposes, the lowest value is held by the Marlins at 19.5 percent. All of the others are in the top half of the league. Keep in mind that these are based on current day valuations, but aside from Kansas City, the last team who to win the World Series who was in the bottom-15 in this category was the 2003 Florida Marlins.
The game has changed considerably over the past decade or so. While there seems to be a consensus around most of the division winners, the addition of the second Wild Card has increased parity, to the point where the MLB arguably has the most across the big-four sports (MLB, NBA, NFL, NHL). It is quite rare to see a team even participate in back-to-back World Series nowadays.
But as depicted above, when will be the next time we see a “small market” team win it all? This is not to say that they do not possess the talent – teams like the Brewers (30.4 percent of franchise’s value attributable to its city and market, ranking 25thin the league) and the Indians (35.7 percent, 19th) certainly have rosters that could make a run in the postseason. It just seems that the bigger market tends to win out. For the Yankees’ sake, let’s hope that trend continues.


