Looking at the stats Yankees pitcher Michael Pineda has put up and looking at his actual performances tell two different stories. The stat line shows an good, but not great pitcher- a 3.64 ERA, a 1.20 WHIP, the 9-5 record, but it doesn’t tell us the whole story. Watching him pitch, he’s been a veritable mixed bag. In his last ten starts, Pineda has allowed 2 runs or fewer while striking out 8 or more on five occasions, but has given up 4 or more runs while striking out 4 or fewer on four occasions. Fortunately, however, Pineda’s pitching profile and advanced metrics indicate that the big righty is due for some major positive regression in the second half.
Pineda’s peripherals paint the picture of an All-Star caliber starter. Pineda, on average, has struck out more than a batter per inning while walking just over one batter per nine innings. His 8.54 K/BB ratio is second among all qualified starters to only Washington’s Max Scherzer. There has been quite a bit of bad luck in Pineda’s profile as well. He has only stranded 70.7% of base runners and opposing hitters have a .345 average on balls in play against him. The 70.7% number is tied for 29th-lowest among qualified starters and the average on balls in play is 4th-highest. Both of these numbers are due to regress by sheer luck. Assuming hitters stop getting lucky and Pineda is also able to strand more base runners, his numbers are due to improve.
But the improvements are not just reliant on luck. Pineda has become more heavily reliant on ground balls and strikeouts. He is now striking out two more batters per nine innings and has seen his percentage of ground balls allowed rise by over 10 percentage points from 2014 to this season. Take a look at these charts from Fangraphs of Pineda’s batted balls allowed in 2014 and 2015.
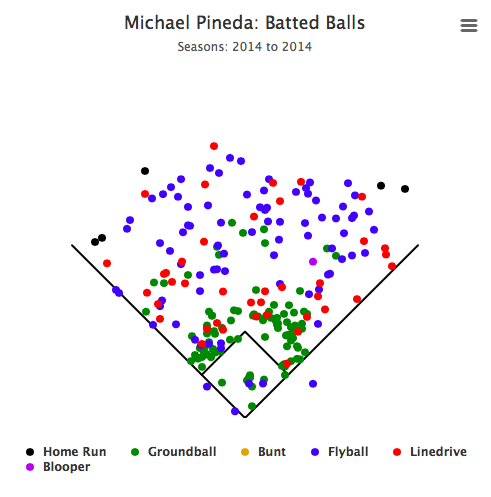
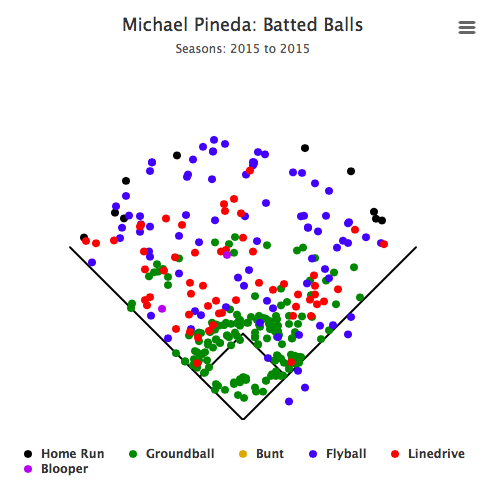
See the increase in green dots in the infield? Pineda has only thrown 30 more innings in 2015 over 2014, but that’s not enough to account for the extent of the increase in ground balls. Pineda is keeping the ball on the ground, and because this keeps away the threat of hard contact and the home run ball, the fall in hitters’ average on balls in play in Pineda will have an even stronger positive effect on his numbers.
Pineda has not seen a change in his stuff, as he is still throwing his pitches with about the same velocity and each of his pitches in around the same proportion. But Pineda’s bad luck and increase in ground balls and strikeouts have made his numbers worse. So what should we expect in the second half? Pineda has a 2.63 FIP, 2.62 xFIP, and a 2.70 SIERA. For the less statistically inclined fan, these numbers take into account what a pitcher’s ERA should be if his batted ball luck is where it should be given the type of contact a batter induces. Pineda’s 1.20 WHIP should be due to fall assuming Pineda keeps his walk rate low and he sees fewer pitches fall for hits as positive regression kicks in.
If Pineda stays healthy (always a concern, especially when he’s throwing his slider over 30% of the time), it seems quite likely that he would be able to post an ERA below 3.00 in the second half while striking out more than a batter per inning. Had Pineda put up numbers like that in the first half, he would have probably been selected to the AL All-Star team pitching staff and may even have pitched his way into the discussion to be an AL Cy Young candidate. Better luck will also increase the likelihood that Pineda goes deeper into games for the Yankees, which should help lighten the load on the bullpen. Add up all the numbers and it looks like “Big Mike” is set to have a big impact on the Yankees’ second-half run for the playoffs.