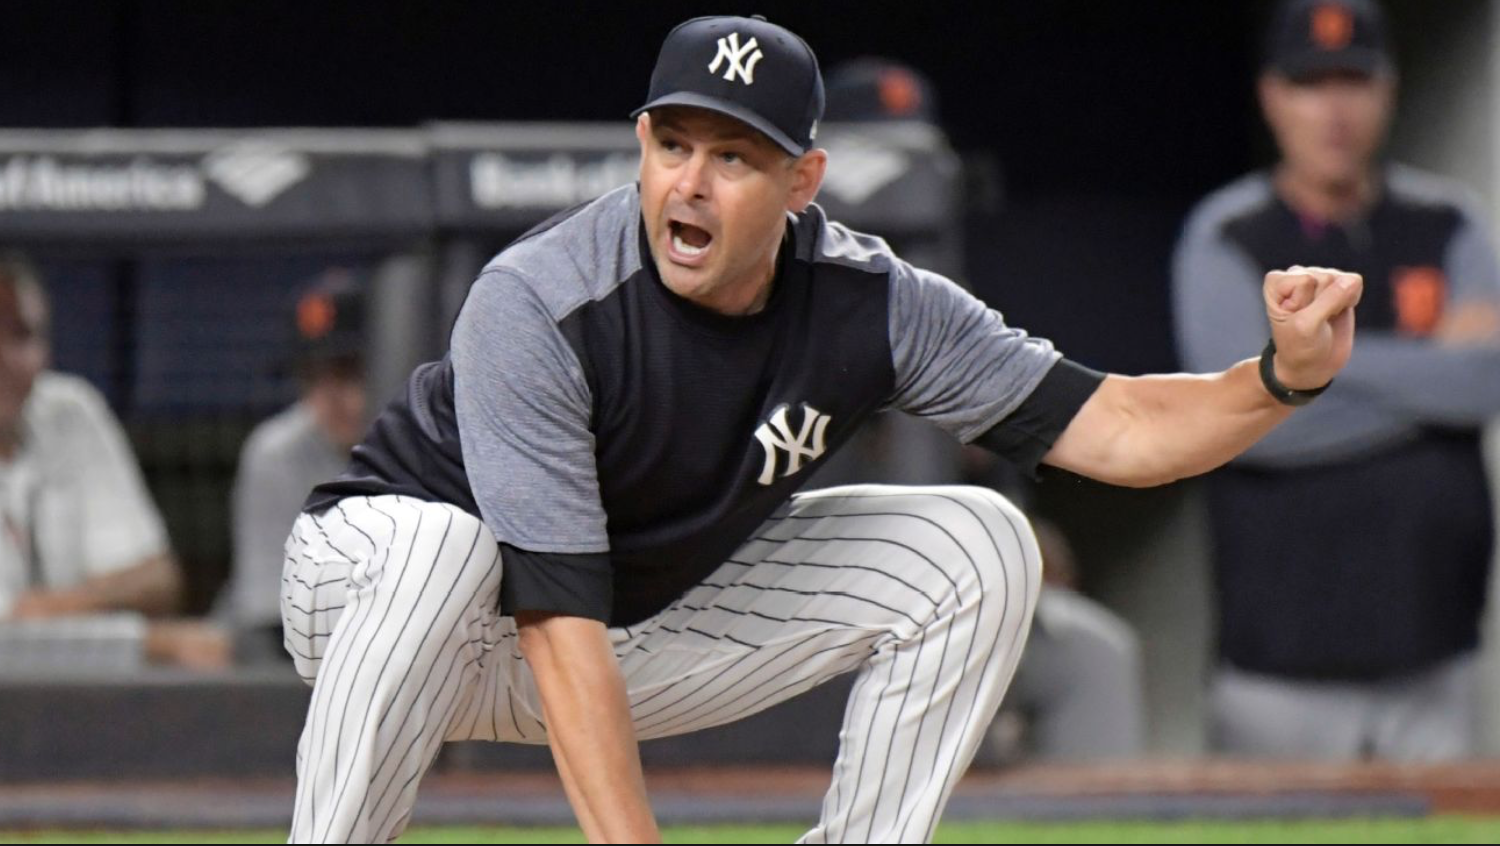
Entering his second season at the helm of the Yankees, Aaron Boone seemingly has become more comfortable making decisions. But has anything really changed since last season? Let’s dive right in.
Bullpen usage
Bullpen usage is a big point when it comes to fans evaluating managers. In 2018, Boone used an average of 4.1 pitchers per game (P/G). That’s up a tick this year at 4.2. Both years have been ever so slightly below league average (96 P/G+ and 99 P/G+ in 2018 and 2019, respectively).
When it comes to usage of different pitchers, the below table gives the breakdown of some of the most-used relivers.
| 2018 | 2019 |
| Chad Green, 13% | Adam Ottavino, 12% |
| David Robertson, 12% | Aroldis Chapman, 12% |
| Dellin Betances, 12% | Zack Britton, 11% |
| Jonathan Holder, 12% | Tommy Kahnle, 11% |
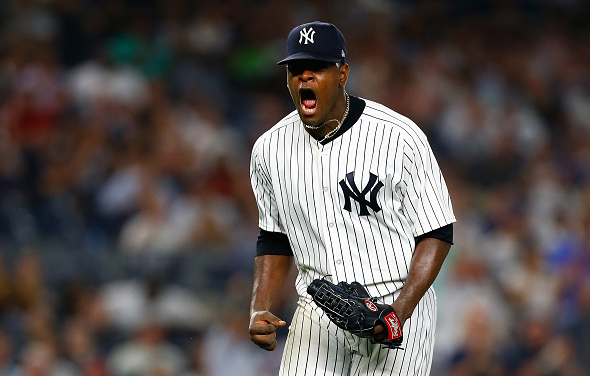
| Aroldis Chapman, 9% | Chad Green, 10% |
| Luis Cessa, 8% | Jonathan Holder, 10% |
Across the board, the distribution appears to be similar. The Yankees are one of only five MLB teams this season to not use a reliever three days in a row. Boone also seems more comfortable bringing in his elite guys in crucial parts of the game, regardless of the inning. Need a strikeout in the sixth? Bring in Ottavino. While people like Britton and Chapman have been more or less set in the eight and ninth innings, respectively, others like Ottavino and Kahnle have been more fluid.
Managerial tendencies
Here are some more numbers of how Boone has managed the past two years.
| Stat | 2018 | 2019 |
| Challenge Overturn % | 74.3 | 69.2 |
| Ejections | 3 | 2 |
| Sac bunt attempt % | 1.1 | 0.3 |
| Intentional walk % | 0.1 | 0.2 |
These are just a few, but Boone is on pace for more perhaps one or two more ejections this year than last. His number of ejections is on par with Joe Girardi’s. Should he be calling it, he is also utilized the sac bunt much less this year. The league-adjusted rate in 2019 has been 28 versus 108 a year ago (where 100 is league-average). For intentional walks, he has always been fairly below the league average: 42 in 2018 and 57 in 2019.
Again, who knows if he is actually the one making all the calls (and if he is just taking the advice from people down the tunnel), but the team’s stealing second and third attempt rates have increased:
| Stat | 2018 | 2019 |
| Stealing 2nd attempt % | 6.4 | 8.3 |
| Stealing 3rd attempt % | 1.5 | 1.8 |
These are both above league-average at 108 for attempting to steal second and 117 for attempting to steal third. This doesn’t necessarily mean their steals were successful, it just indicates that the Yankees have been slightly more aggressive on base paths this season. Girardi averaged 100 for second and 83 for third in his career as the manager of the Yankees.
Love him or hate him, Boone led the team to 100 wins in his inaugural season at the helm and is on pace for 105 this year. Yes, surely he gets a lot of help from the analytics department, but he definitely appears more comfortable and confident in the role.