When watching the Yankees, you could very easily be left confused by why the Yankees trot Stephen Drew out to shortstop or second base most days. His .179/.254/.375 triple slash line screams out DFA more than it does MVP, but despite average defense (Fangraphs has his defense rating at – 0.5 and estimates he has saved 5 runs below average) and sub-replacement level offense, a deeper look into Drew’s stats shows that things should eventually turn up for the veteran infielder.
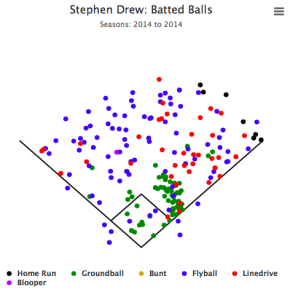
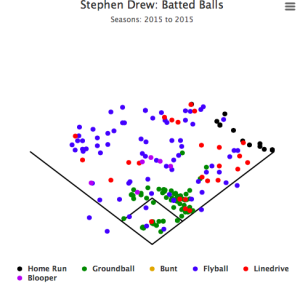
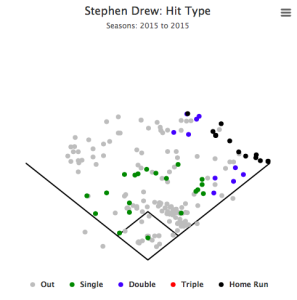
Drew’s .179 average is at least partially held back by a .166 BABIP, worst among all qualified hitters. Now, normally a BABIP that bad is guaranteed to rise purely by luck, but looking at Drew’s spray charts shows that he is falling victim to opposing teams putting on the infield shift. Drew is pulling the ball more than he did in 2014 but defenses have come to expect the lefty to pull the ball. This, combined with the shift demonstrated in his “hit type” chart, would appear to show that the league-worst BABIP is less likely to regress.
While this may be true, we can see that Drew is making an adjustment to the shift by hitting more fly balls. Drew’s ground ball rate is similar to his career average (35.0% this year vs. 36.4% career), but he’s hit a fly ball on 51.8% of his balls in play (compared to a career average of 43.3%.) This has allowed Drew to take advantage of his natural left-handed power and the Yankee Stadium short porch, and may serve as an explanation for Drew’s three multi-homer games. All 11 of Drew’s home runs have gone to right field, and 8 of those have come at home. While Drew has a career high HR/Fly Ball ratio of 10.8% (compared to 7.8% career,) the changes in Drew’s batted ball profile seem to warrant a rise in the rate of fly balls he’s hitting out of the park.
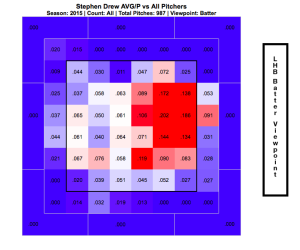
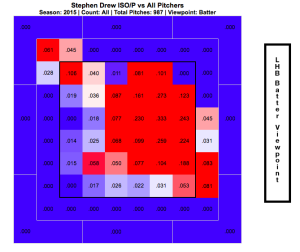
Another promising sign that Drew will be able to improve is his plate discipline. He has only struck out in 16.3% of plate appearances this season, a marked decline from his past three seasons where he struck out 23.2%, 24.8%, and 25.0% of the time, respectively. He also continues to walk at good rate, walking in 9.3% of his plate appearances. This discipline means that Drew can wait for pitchers to make a mistake and give him a pitch where he could drive it, in his case around belt high and on the inner half of the plate. Drew’s highest batting averages and isolated power numbers come on pitches in those areas.
The numbers seem to show then that, while Drew will likely not be putting up all-star numbers, he can at least shine at home and against righties. Drew has actually put up reverse platoon splits, hitting for a worse average against righties than lefties. This, however, likely has more to do with the fact that Drew has only seen 67 plate appearances against lefties this season. Drew’s power has come out against righties, as righties have given up 10 of Drew’s 12 home runs this season. Assuming Drew can improve his average against righties and beat the shift occasionally either by squeaking one through the opposite way or getting loft when he does pull the ball, he should be able to improve his stat line and also keep up his power pace.


