Baseball season is finally upon us, so it’s time to take advantage of some Yankees prop bets. In this article, I used odds from the Las Vegas Sports Book (LVSB) and advanced metrics research from Fangraphs, Baseball Savant, and Statcast to try and make the most accurate projections. *In no way is this an endorsement for sports gambling or LVSB, nor am I guaranteeing the outcome of any of the following predictions.*
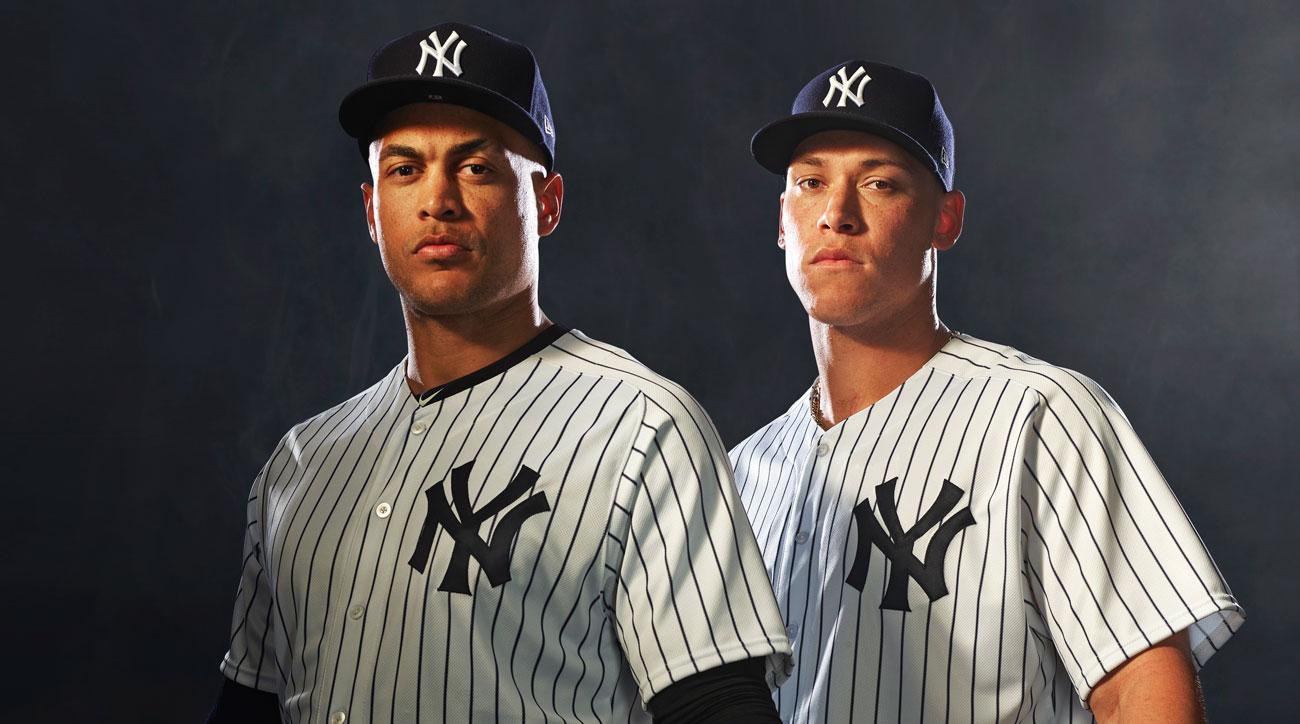
Let’s get the Judge and Stanton props out of the way to start. Since Giancarlo was shipped to New York in December, the LVSB has created multiple props:
Think @Giancarlo818 feels at home in Atlanta?
Counting this 114.2 mph blast in last night’s exhibition game, the @Yankees slugger now has the four hardest-hit HRs at SunTrust Park. pic.twitter.com/EtlC9ilWCi
— #Statcast (@statcast) March 27, 2018
Over/Under Stanton-Judge HRs combined: 87.5 – Over +100, Under -120
The way I see it is there are two key factors to Giancarlo and Judge going over this number: Stanton’s health and a potential sophomore slump for Judge. Last year Stanton played in a whopping 159 games, which was the first time he played more than 150 games since 2011 when he was 21-years-old. He’s also played in 123 games or less in five of his eight big league seasons. Despite his injury history, Stanton is coming off his best season yet and will be protected by a potent lineup that ranked 3rd in total offense according to Fangraphs. He’s also coming off of a season where he posted career highs in key advanced metrics categories: OPS+ (165), WAR (7.6), and wOBA (.410). Fangraph’s projections have Stanton hitting 48 home runs in 2018. An article I wrote earlier this winter can also help quantify why he will hit even more home runs playing in AL East ballparks.
As for Judge, the biggest question is can he repeat his unprecedented rookie season. Coming off of arthroscopic shoulder surgery this winter, it may have had an adverse impact during a stretch last year in which he was invisible at the plate. Despite this, Judge still trumped Stanton’s MVP year in every sabermetric category: OPS+ (171), WAR (8.1), wOBA (.430). He also surpassed Stanton in BABIP (batting average of balls in play) .357 vs .288, and wRC+ (weighted runs created) 173 vs 156. Unlike Stanton, however, it is difficult to project how a player will fare using just one full season of statistics. Something that can help you decide whether that may be true or not: Scott talked to Judge’s hitting coach Richard Schneck on the Bronx Pinstripes Show recently. You can listen here..
I would bet that Judge shows no signs of slowing up. On R2C2, Brett Gardner talked about staying late after practice and running hills with Judge. During the post-practice sprint sesh, in which Gardy said Judge took one stride for every six he did, Judge told him, “There’s been a lot of one-hit wonders, and I’m not gonna be one of them.”
According to Statcast and Baseball Savant, Judge and Stanton also hit some balls decently hard, and far last year. Max velo: Stanton, 122.2MPH (1st), Avg exit velo: Judge, 94.9MPH (1st), Max HR distance: Judge, 495ft (1st), Barrels: Judge, 87 (1st) Stanton, 76 (2nd)
My pick: Over 87.5
Over/Under Stanton-Judge Ks combined: 327.5 – Over -115, Under -115
I think Vegas drastically undershot this one. If both Giancarlo and Judge stay healthy the entire year and get at least 500 at-bats each, there is no reason why this wouldn’t go over. Here’s why:
In seasons that Giancarlo Stanton has had over 500 ABs, he has struck out 163 times or more:
2011: 166K in 516 AB (27.6%)
2014: 170K in 539 AB (26.6%)
2017: 163K in 597 AB (23.6%)
There is, however, an important caveat here. As I mentioned earlier, Giancarlo has played in 123 games or less in 5 of his 8 big league seasons. Injury is certainly the biggest question mark, but his 6% drop in strikeout rate from ‘16 to ‘17, the biggest of his career–could also potentially mean fewer strikeouts for the big man. Take this information how you may, but if Stanton is healthy the whole year, he’s a safe bet to strikeout at least 150 times.
Last season, Aaron Judge struck out 208 times in 542 ABs, which equates to a 30.7% K rate. While Judge has fewer numbers to draw comparisons to help get a better estimate of just how many times he’ll K, I would say that number is no less than 185. Could swing adjustments he made in the off-season shed a few Ks off that 208 total? Sure. But at the end of the day, he’s a 6’7” textbook power hitter who is going to strikeout. A lot.
My pick: Over 327.5
In the era of advanced metrics, wins and ERA are no longer staples for how to evaluate pitching performance. Instead, metrics such as fielding independent pitching (FIP) and Fangraph’s pitch values have become better ways to project success or failure. FIP examines what ERA ignores: a pitcher’s strikeout, walk, and home run rate. These are areas that the pitcher has the most control over. Pitch value accounts for the repertoire a guy has, and how opposing hitters fare against certain pitches. Pitch values find the sum of changes in run expectancy before a pitch is thrown until after it is thrown, giving value to each pitch a guy has to deal. The LVSB unfortunately only had Sevvy and Gray for o/u on regular season wins, but let’s take a look at how we can best forecast their 2018 performances.
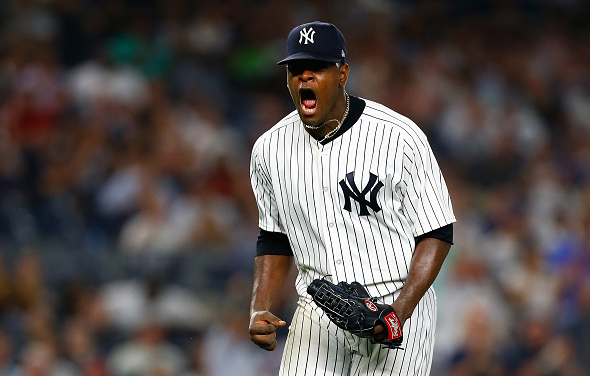
Over/Under Luis Severino Wins: 14.5 – Over -115, Under -115
Sevvy is coming off of his best season yet. Posting a 2.98ERA with a 14-6 record, he proved himself as a bonafide ace and earned himself the honor of starting on Opening Day this season. He is the youngest Opening Day starter for the Yankees since Lefty Gomez in 1932. Severino struck out 230 guys in 193 innings, good for a 23% K rate and career highs in FIP (3.07) and Fangraph’s pitcher value. The 24-year-old posted a 9.6 pitch value last year, good for 6th best among SPs in the bigs. As for his 14 wins, well, his performance helped, but the run support was out of control. Sev had help in a major way last season, as the lineup backed him up with 6.2 runs per game–good for the 4th best in baseball.
Embed from Getty Images
Wins have always been difficult to predict because there are many variables that go into projecting them, the most prominent being pure luck. Overall, wins have proven that like ERA, they aren’t really good measures of how talented a pitcher is. The biggest question to ponder in this one is, can the Yanks give Sevvy 6.2 runs per game again? Not so sure.
My pick: Under 14.5
Over/Under Sonny Gray Wins: 13.5 – Over -115, Under -115
Something I was blown away by was Sonny Gray’s home run rate in the 2nd half of last season following his trade from Oakland. He gave up twice as many home runs per game in Yankee Stadium after the move, which helps explain why he gave up a career-high 19 HRs last season. Despite the increase in home run rate, Sonny is backed by a lineup that now features Giancarlo Stanton.
Embed from Getty Images
Last year, Gray was 42nd in the league in terms of run support, as his team put up 4.7 runs per game for him. If he can get the same kind of run support that Sevvy got, his career 3.67 FIP shows that he can pitch with a purpose and have success. However, his pitch value is a cause for concern as it was only 2.6 last year, and at its best was 4.2 in 2014. Gray posted 10 wins total last season, which I expect him to surpass, just not 13 this year.
My pick: Under 13.5
Over/Under Regular season wins: 94.5 – Over -110, Under -110
Here’s the one you have all been waiting for, and one that I have tried to remain as objective as possible about. Let’s be honest, we all know that this can go over, and we’re all hoping it does. I found two key factors of the Yankees’ schedule that can help quantify why it will.
Last year, the Yankees blew a ridiculous amount of games that left you going to bed with a bad taste in your mouth. Despite the astronomical number of 21 blown saves, the Yanks found a way to scrape together 91 wins and grab a wild-card spot. According to Fangraph’s Pythagorean theorem for calculating wins, the Yankees should have had 101. Mid-season struggles from the likes of Aroldis Chapman and Dellin Betances are what left them well short of that number. This year, however, their schedule is very much in their favor. With 18 matchups against the NL East in interleague play and a 25-game stretch post-trade deadline against likely sellers, I really like the over on wins here.
The Yankees got the benefit of the doubt with the interleague schedule this year, as they will predominantly face teams from the NL East in every month besides April and September. Arguably the weakest division in the NL, the Yankees play 18 games, 8 of which will be at home in the Bronx. They’ll sign up for that.
After the trade deadline this year, the Yanks will have an absolute cakewalk of a schedule against teams that are more than likely going to sell. There is a 25-game stretch beginning in the 2nd week of August that includes matchups against the White Sox, Rangers, Rays, Jays, Marlins, and Orioles. 17 of these games will be played in the friendly confines of Yankee Stadium, where the squad posted a 51-30 record last season, good for the 3rd best in baseball.
Let’s run it!
My pick: Over 94.5