There have already been three no-hitters this season. It’s May 10th. There have almost been as many no-hit bids through six innings this year as there were all of last year. What’s the cause of this sudden influx of no-nos?
Strikeouts are up
One reason is the spike in strikeouts. This could be from a multitude of factors, including shifts. With teams shifting now more than ever, some executives believe that hitters may be trying to circumvent them by hitting the ball over the infielders’ heads. This is done by having more of an uppercut in their swings and as a consequence more swings and misses. The ground-ball to fly-ball ratio is at it’s lowest in recent history, meaning more balls are being hit in the air.
| Season | K% |
| 2014 | 20.4 |
| 2015 | 20.4 |
| 2016 | 21.1 |
| 2017 | 21.6 |
| 2018 |
22.7 |
As you can see above, the strikeout rate has continued to increase.
Swing analysis
| Season | O-Swing% | Z-Swing% | O-Contact% | Z-Contact% | Contact% | SwStr% |
| 2014 | 30.70% | 65.70% | 65.70% | 87.30% | 79.30% | 9.50% |
| 2015 | 30.60% | 66.90% | 64.90% | 86.70% | 78.80% | 9.90% |
| 2016 | 30.30% | 66.70% | 63.90% | 86.30% | 78.20% | 10.10% |
| 2017 | 29.90% | 66.70% | 62.90% | 85.50% | 77.50% | 10.50% |
| 2018 | 29.60% | 66.60% | 62.10% | 85.20% | 76.70% | 10.60% |
More specifically, you can see that even though the rate at which players are swinging at pitches out of the zone (O-Swing%) is at it lowest in the last five years, they are making less contact on those pitches (O-Contact%), as well as those in the zone (Z-Contact%). And overall, they are making less contact (Contact%).
Also, fastball usage has been gradually going down across the league, and with all of these factors mixed together, it creates a scenario where hitters are striking out more than ever and pitchers are able to exploit this. They are more throwing pitches out of the zone, which also leads to the walk rate being high across the board.
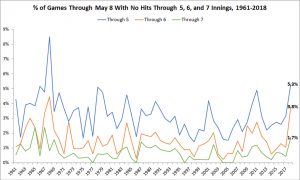
Here’s shocking tidbit from Ben Lindbergh of The Ringer: April 2018 was the first month in Major League history where there were more strikeouts than hits. He also presented the below graph, which shows the percentage of games through May 8 of each season from 1961 that had no-hit bids through five, six, and seven innings.
Will it continue?
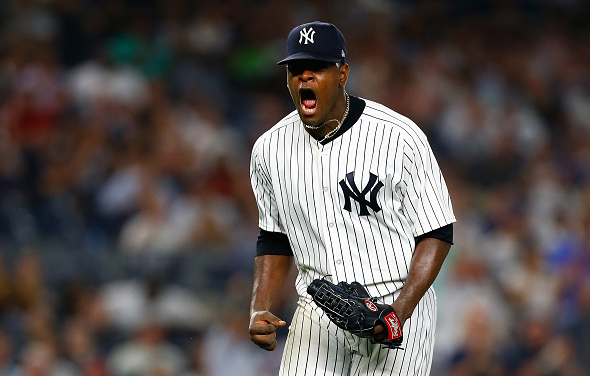
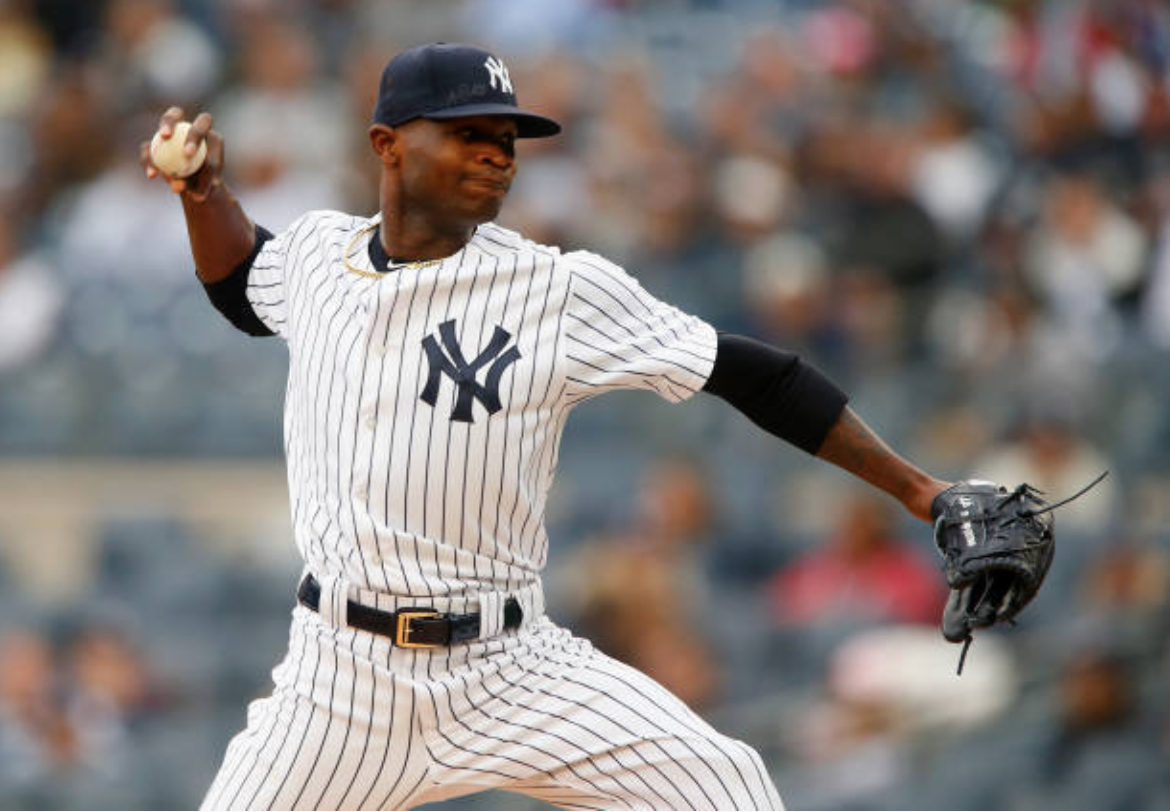
But how is this happening with starting pitchers only averaging approximately 5.47 innings per start? Additionally, we no longer see many eclipsing the century mark in pitches too often, yet we’re set to witness a slew of no-hitters this season. Even Domingo German, making his first Major League start, was limited to six innings in his no-hit performance. While all of this is true, it just seems like the perfect storm with pitchers throwing harder than ever, more breaking pitches than ever, and more out of the zone than ever that there will be more games susceptible to having teams being unable to manufacture a single hit.