Sevy vs. Thor: whose fastball rules New York?
Over the past couple of years, many have compared the Yankees’ Luis Severino and the Mets’ Noah Syndergaard. Both play in New York, both made their debuts in 2015, both feature high-octane fastballs, Severino is 24-years-old while Syndergaard (“Thor”) is 25. The two were scheduled to face off on Sunday Night Baseball as Thor returned from the disabled list. However, his return got pushed back due to him feeling a bit sore a couple days before.
Syndergaard has been fairly consistent as a starter since coming up to the majors, but Severino struggled in the role in 2016 before finding his footing again last season. One can make the argument that Jacob deGrom is the Mets’ ace, but Syndergaard is definitely up there as well. So according to the stats, who has been better: Syndergaard or Severino?
The Breakdown
They have thrown a comparable number of innings in their career as of June 9, 2018: 428.2 for Syndergaard and 412.2 for Severino.
Since their debuts in 2015, Syndergaard (98.3 miles per hour) and Severino (97.4 miles per hour) rank first and second, respectively, in average fastball velocity for starters (PITCHf/x). Here are some other stats on their fastballs throughout the career:
FB % wFA (runs above average) wFA/C (per 100 pitches) Horizontal Movement (in.) Vertical Movement (in.) Severino 51.7 12.3 0.36 -4.5 9.5 Syndergaard 58.5 13.7 0.70 -2.9 10.2
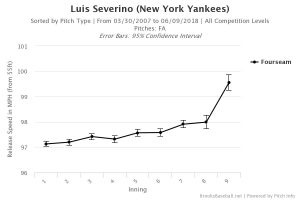
Both clearly feature exceptional heaters that have the capability to get any hitter out. And neither seem to lose it as the game goes on, as seen below. In fact, Severino seems to get even better with his fastball in terms of velocity as the game progresses!


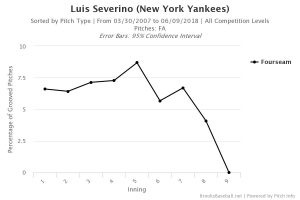
Furthermore, it can be seen that Severino grooves fewer pitches as the game goes on, while Syndergaard’s percentage of them spikes in the later innings. For reference, Brooks Baseball essentially defines “grooved pitches” as pitches that are middle-middle.


How about some more graphs! Specifically, in regards to their fastballs, Severino’s whiff percentage has continued to climb since his debut, while Thor’s has been trending in the opposite direction. This is likely in part due to Syndergaard’s recent injury history.


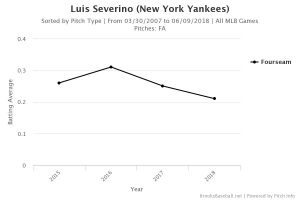
Lastly, let’s take a look at how well hitters have fared against these behemoths of a pitch. Severino’s batting average against on his fastball was clearly up in 2016 (his down year), but it wasn’t even as high as Syndergaard’s has been this year in his limited action. In fact, Syndergaard’s has increased each year while Severino’s has decreased minus the outlying 2016 season.


Even though there may be some bias, at the moment I would have to side with Severino’s fastball given the trends. Of course, both pitchers feature terrific secondary offerings to pair with their fastball, but you frequently see their two names at the tops of velocity leaderboards, so that’s where I decided to delve into.

