The case for the Yankees to bring back Masahiro Tanaka
I felt as if after 2020 it was time to change things up and let go of Masahiro Tanaka after seven really nice years as a Yankee. He returned back to Japan, where he signed a two-year contract with a potential opt-out after year one. This always left the door open for a potential return of Tanaka.
Cashman was even quoted saying, "There’s no door closed, let’s put it that way from my perspective.” Tanaka expressed his interest in returning to the Yankees, and I think the biggest reason he didn't was due to monetary constraints. I don't think Masa is an elite starter, but he's a lot better than most FA options. This is a weaker starting pitching market, and Masahiro Tanaka could provide the Yankees a ton of value if he were to return.
The Surface Stats Aren't The Full Story
Masahiro Tanaka's 2019 and 2020 seasons were not spectacular when grouped together. Let's look at how he stacks up against the pack in ERA, FIP, xFIP, and SIERA.
ERA-: 94 (57th/106) FIP-: 93 (51st/106) xFIP-: 94 (46th/106) SIERA: 4.39 (51st/106)
Well, it seems like Tanaka can't really provide much more value than being an average starter. Among pitchers with 150 or more innings from 2019-2020, he's right in the middle of the pack in all park-adjusted ERA, FIP, xFIP, and in SIERA. Seems like he shouldn't get much of a market from the Yankees, but what if I were to tell you there's more to dig up for Tanaka? Let's introduce you all to Expected Run-Value.
Expected Run-Value and Why You Should Use It
This is not as much of a metric as it is a model. Developed by Cameron Grove, it aims to predict what a pitch in a certain location based on many different factors should result in. These outcomes range from swinging strikes to line drives to foul balls.
The model takes this information from every pitch said pitcher has thrown in a season and creates an Expected Run-Value for the pitcher and each of their pitches. Negative Run-Value means you've thrown a good pitch, positive run-value means you've thrown a poor one. It's rather accurate with Run-Value, which is a metric on Baseball Savant that can be found here! We're trying to see if a pitcher's repertoire should have a high success rate, and that can play a huge role in how we value a potential diamond in the rough.
As for any other questions about Expected-Run Value that I could not answer, Cameron Grove wrote an entire article detailing the metric. You should check it out and support his work, he does phenomenal stuff. We have less sophisticated data than ones used within MLB organizations, but the Yankees could definitely have some data that thinks highly of Masahiro Tanaka as well.
Tanaka's Incredible Potential
Tanaka's 2019 was one of his worst, posting his 2nd worst ERA-, worst SIERA, and worst xFIP-. Despite that, he had the 19th best xRV/100 among ALL pitchers in baseball. That even includes relievers, totaling 702 pitchers. He took a step back in 2020, but he still was incredibly impressive in his xRV. Here's how he stacks up in xRV and his overall pitch grade.
Year xRV Overall Grade 2019 -0.79 70 2020 -0.42 60
For Overall Grade, it's scaled the same way scouts grade tools, which is on a 20-80 scale. Masahiro Tanaka's Splitter, Slider, and Curveball are all graded extremely well in this model, but I think the X-Factor here is his fastball.
Tanaka's fastball has been putrid when batters make contact with it, as it has an over .400 wOBA against every year since 2017. That's...not good to say the least. He can be much more than a pretty solid starter if he were to even have an average fastball. The Yankees were able to turn around Nestor's fastball completely, and if you compare the properties of both Tanaka's fastball and Nestor's there are some striking similarities.
Player CSW% Active Spin RPM MPH Extension Vertical Movement Masahiro Tanaka 26% 96% 2231 92.3 6.1 inches 15.3 Inches Nestor Cortes Jr. 28.8% 93% 2224 90.7 6.0 inches 14.7 inches
Both differ in location, but they throw from different arm angles and one is a lefty and the other a righty. Not really the fairest comparison, but still worth a look. Why don't we try to predict where Tanaka's fastball would have the most success based on 2021 data?
Playing a Number's Game
Using Cameron Grove's Pitch Tester, we can place a fastball with Tanaka's properties wherever we want in the strike zone and see its expected run-value.
(The graphics are from the catcher's perspective, so the right side is the 1st base side, the left side is the 3rd base side.)
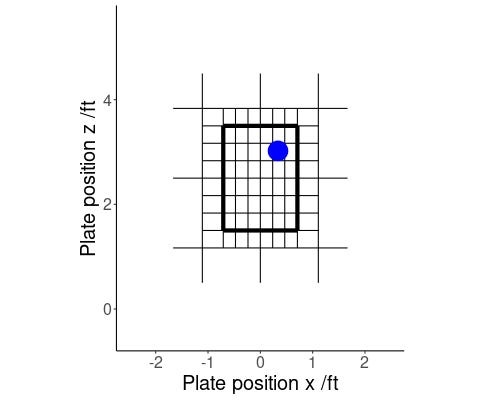
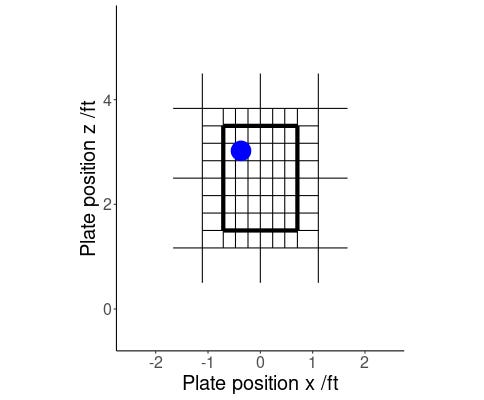
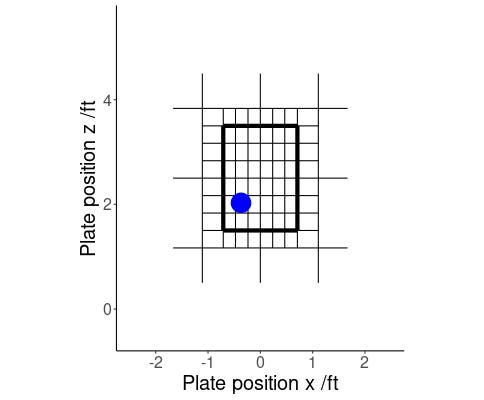
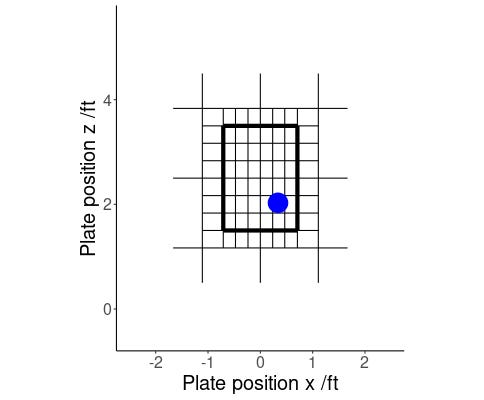
Based on these four locations which I've labeled by Quadrant as 1, 2, 3, and 4, here are the Run-Value results:
Quadrant xRV 1 -1.4 2 -2.0 3 -2.2 4 -1.5
What we can conclude is that the average Tanaka fastball would succeed in all 4 quadrants (so it's a good pitch), but it would work best in Quadrants 2 and 3 most likely. How about against lefties?
Quadrant xRV 1 -1.5 2 -3.1 3 -3.2 4 -1.7
Using the same 4 locations (quadrants), his fastball would do incredibly versus left-handed hitters, with it doing extremely well on the 3rd base side of the plate against lefties as well. Let's look at his fastball heatmap from 2019-2020 however, as it shows that he doesn't reside heavily on the 1st base half of the plate.
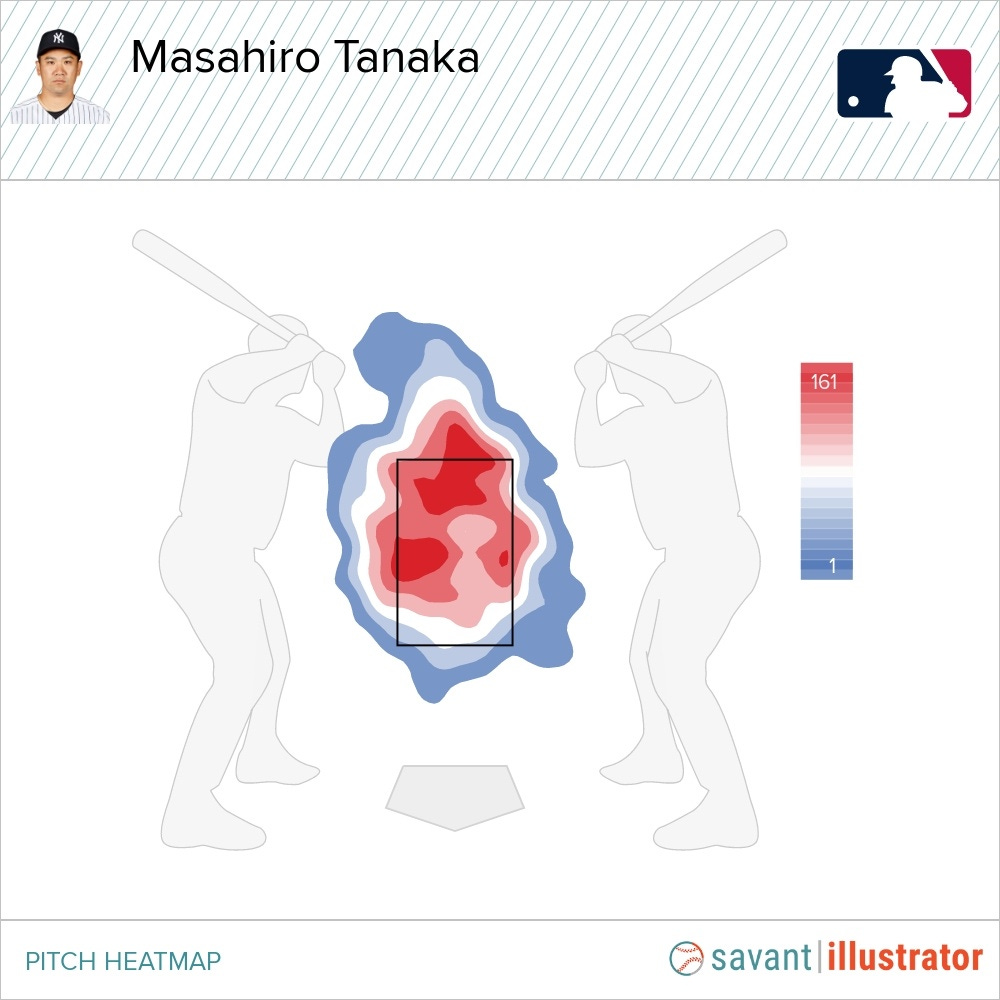
This is his fastball heatmap from 2019-2020, and he's way too much in the heart of the zone for my liking. Let's compare it to where his suggested pitch location is:
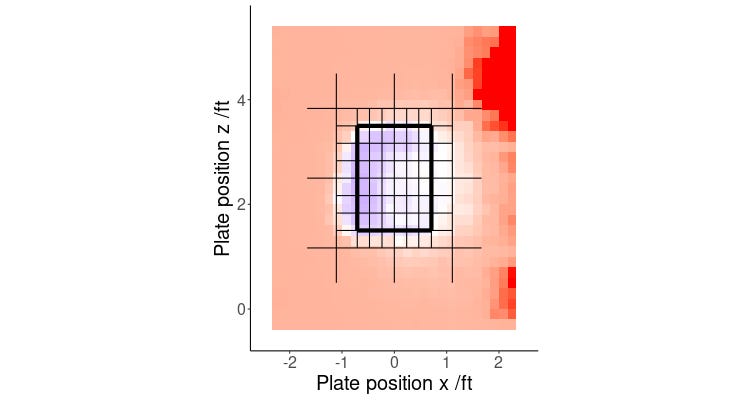
The blue is where the pitch tester suggests his fastball should be, with the red being where his fastball is less effective. This is a very different heatmap than the one we see for Tanaka, and it could mean that Tanaka's fastball is simply not being located in the proper areas for success.
Sure, Tanaka isn't going to be a dominant ace or even a top 25 starter like he was from 2014-2016, but he's certainly a very solid starter, and we should bring him back.

