


Examining the Yankees' schedule
Examining the Yankees' schedule
The Yankees have been mediocre since the calendar has turned to September, compiling a 6-8 record. In fact, they have been rather mediocre since the All-Star break, with a record of 91-58. However, they still have already matched last year’s win total at 91 when they clinched the first Wild Card spot by six games over the Minnesota Twins. Last year was not supposed to go as well as it did for the Yankees. It was supposed to be their “rebuilding year.” However, their 91 wins placed them eighth overall in the entire league, and much of it was due to a strong 21-9 start as well as a 20-8 September.
YEAR
ONE-RUN GAMES
BLOWOUTS (5+ RUNS)
2017
18-26 (.409)
37-13 (.740)
2018
21-15 (.583)
28-12 (.700)
As seen above, one thing the team has improved on this season has been one-run games, winning a majority of them. However, they’ve blown-out teams less.
2017
In 2017, the Yankees went 91-71, but their Pythagorean win-loss record was 100-62. This takes into account runs scored and runs allowed, and the Yankees outscored their opponents by 1.2 runs on average per game (5.3 to 4.1). Another metric used to examine a team’s season is the strength of schedule. This is the number of runs per game that their opponents are better or worse than the average team. This factor ranged from +0.3 to -0.3 in 2017. Putting the two together yields the Simple Rating System (SRS) which sums a team’s run differential and their strength of schedule. The Yankees ranked second in the league with a 1.3 SRS right behind Cleveland’s 1.5.
2018
How about this year’s team? As of Sept. 17, their record is 91-58. They have outscored opponents on average by 1.05 runs (5.12 to 4.07) leading to a Pythagorean win-loss record of 90-58. Thus, they are actually projected to be doing slightly worse than they currently. However, run differential doesn’t necessarily paint the whole picture. A team could be 81-81 and all 81 wins could be 20-0 blowouts and all 81 losses could be 10-0 routs. That translates to a +810 run differential – does that mean the team has been unlucky to be 81-81? Perhaps not. But if we are to look at run differential, here’s how it has broken down each month this year for the Yankees:
MONTH
RUN DIFFERENTIAL AVERAGE RUNS SCORED PER GAME AVERAGE RUNS ALLOWED PER GAME AVERAGE RUN DIFFERENTIAL WINNING %
March/April
+46
5.857 4.214 +1.643 .643
May
+24 5.400 4.440 +0.960
.680
June
+31 3.963 2.815 +1.148
.667
July
+38 5.600 4.080 +1.520
.600
August
+14
5.167
4.700
+0.467
.567
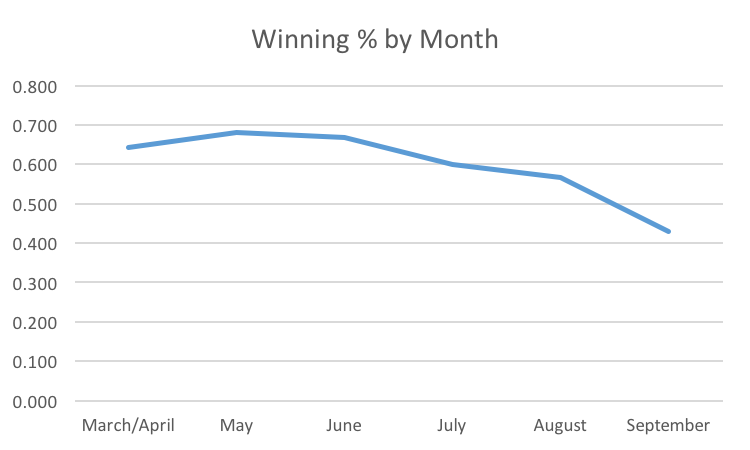
September +4 4.429 4.143 +0.286
.429
As one can see, August and September have been months where the average run differential has dwindled. They are still positive, but look at the winning percentages for those months – the Yankees are playing under .500 ball in September. This is a time when they are trying to hold onto the first Wild Card spot over the Athletics, who have essentially been the Yankees in reverse in the fact they have had a very strong second half. Overall, there are some rough inverses that can be seen between the 2017 and 2018 seasons. For example, the 2017 team started out hot, swooned in the middle, and finished strong. The 2018 Yankees started slow, got hot in the middle, and have fallen off at the end. Last year we saw a large slugger in Aaron Judge absolutely rake in the first half of the season. Then he fell off a cliff before coming back with a strong September. This year, it is Giancarlo Stanton doing exactly the opposite: starting slowly, getting hot in the dog days of summer, and now not being able to hit his weight (which, to be fair, is higher than most). Can they turn it around? Hopefully, the imminent returns of Judge and Aroldis Chapman are enough to re-spark this team and carry them through the playoffs.