The 2021 Yankees have severely underperformed. As of Wednesday afternoon, they sit 2.5 games out of the second Wild Card spot (only one in the loss column) and nine back in the division (eight in the loss column). They haven’t missed the playoffs since 2016, and they also missed the dance in 2013 and 2014. Is this year’s team as bad as those years’?
For this exercise, I am not paying attention to expectations. For example, the 2013 Yankees obviously had lower expectations than the 2021 Yankees. I am simply comparing the stats. Additionally, everything below is looking at the time period from 2013 to 2021.
If you remember (or maybe you’ve completely blocked it out of your memory), the 2013 team featured superstars such as Travis Hafner, Ben Francisco, Lyle Overbay, and the like. The only position player of significance was Robinson Cano.
Batting
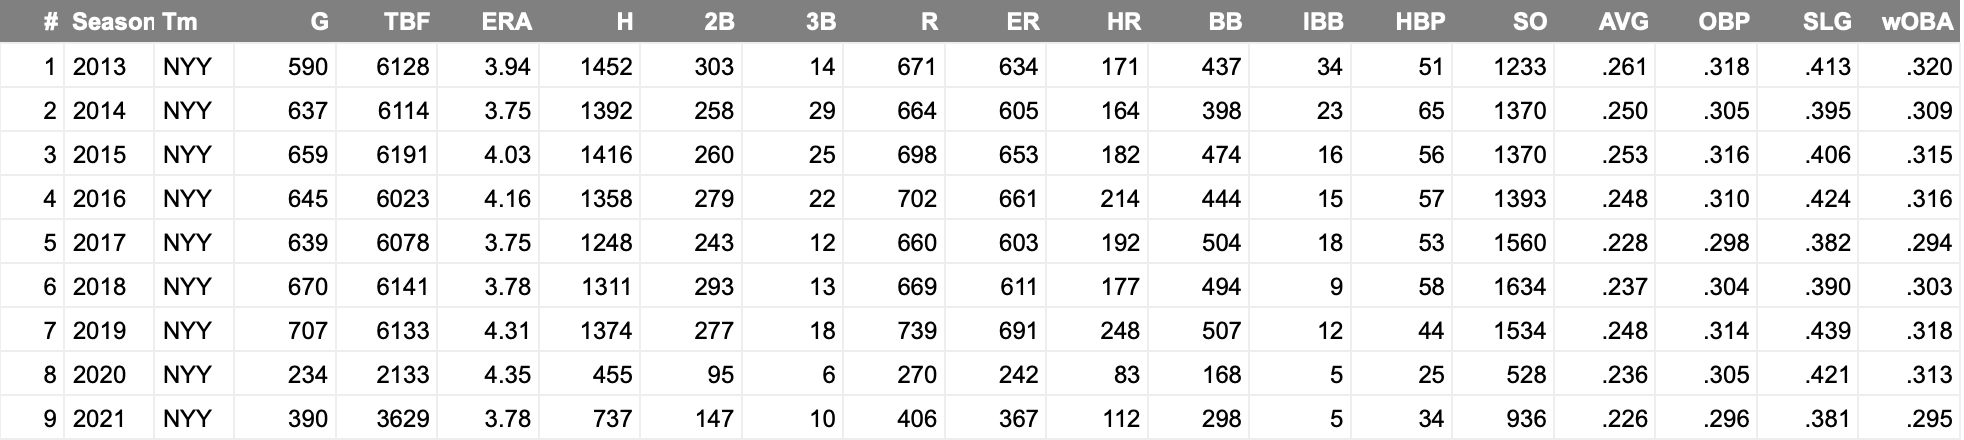
Here are the standard stats:
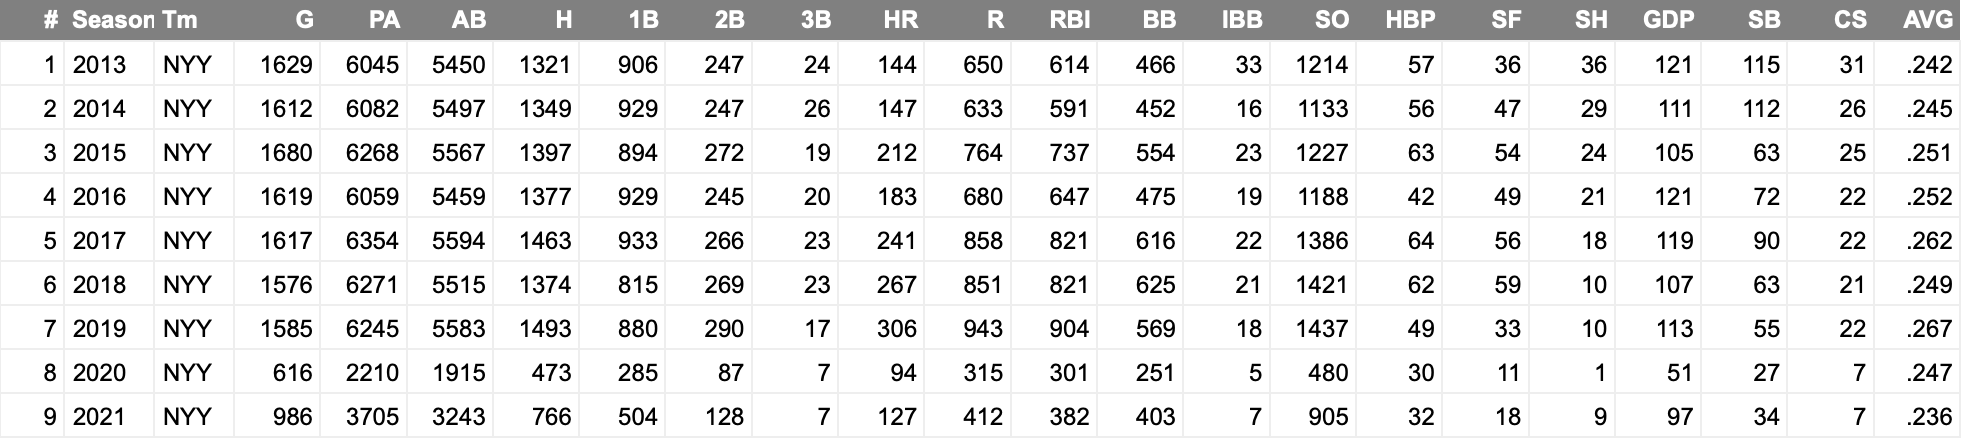
Of course, batting average is not extremely meaningful, but this year’s team has the lowest batting average since 2013 at .236.
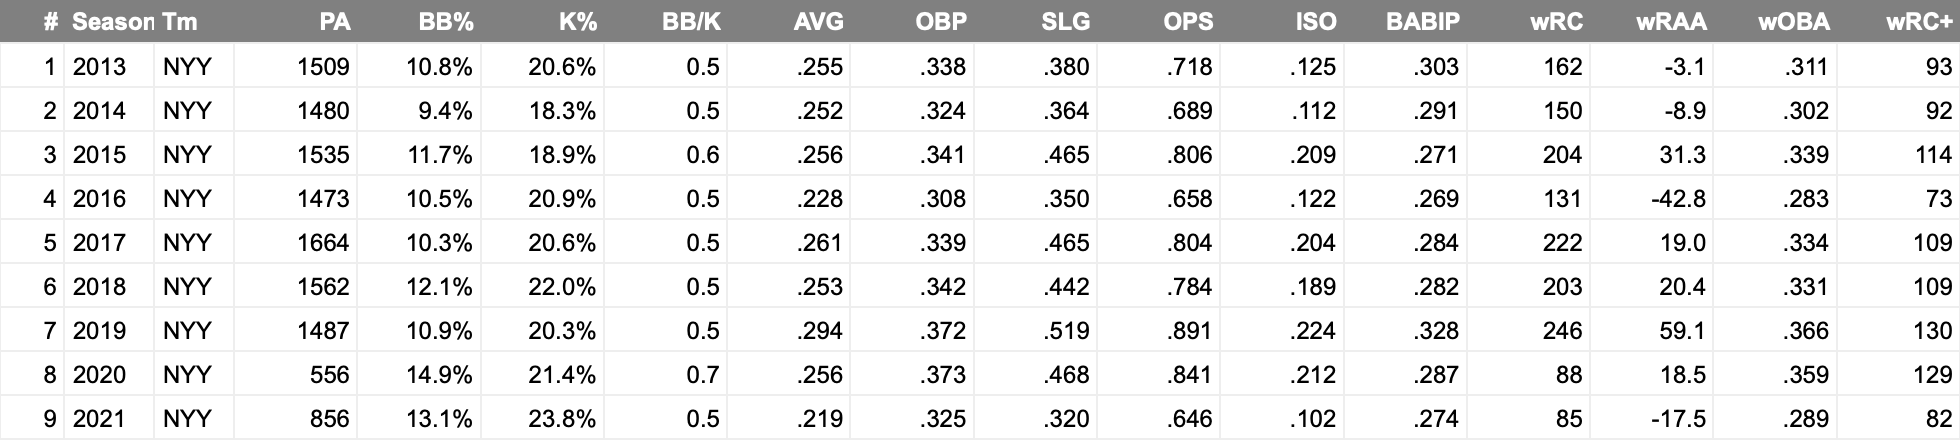
Looking at some more advanced stats, we can see that even though the ’21 team has been league-average when it comes to wRC+, the 2013 team was very poor at 86. The following year was also below average at 94, as was 2016 when the mark was 92. So each year they’ve missed the playoffs in the last eight seasons, they’ve had a below-average wRC+. The more recent teams (since 2018) have also had walk rates above 10 percent outside of 2019. Earlier in the decade, this number was also below 10 percent.

The 2021 team’s SLG and ISO are also way down at .397 and .161, respectfully. Their slugging has not been that bad since the 2013-2014 non-playoff teams, and their ISO hasn’t been that bad since the 2016 non-playoff team.
Another unfortunate stat? This year’s team has a groundball-to-flyball rate of 1.27 — the same as last season. Other than those two times, the only other time that rate was over was 2013 (1.24), 2014 (1.25), and 2016 (1.32). All other times it was no higher than 1.16. This means that we have been really pounding the ball into the ground, which explains the extremely high amount of double plays. As a team that typically is built to hit many home runs, if you are hitting a lot more grounders than fly balls, it’s not a great sign. The Yankees lead the league, by the way, by grounding into 0.98 double plays per game. The Rays are last, grounding into only 0.42 per game.
And just for fun, let’s take a look at with runners in scoring position:
This year’s 82 wRC+ with runners in scoring position would easily be the worst mark from 2013-2021 if not for the 2016 Yankees. Once again, the only teams to not be above average in terms of wRC+ with runners in scoring position were the 2013, 2014, and 2016 teams, all of who did not make the postseason.
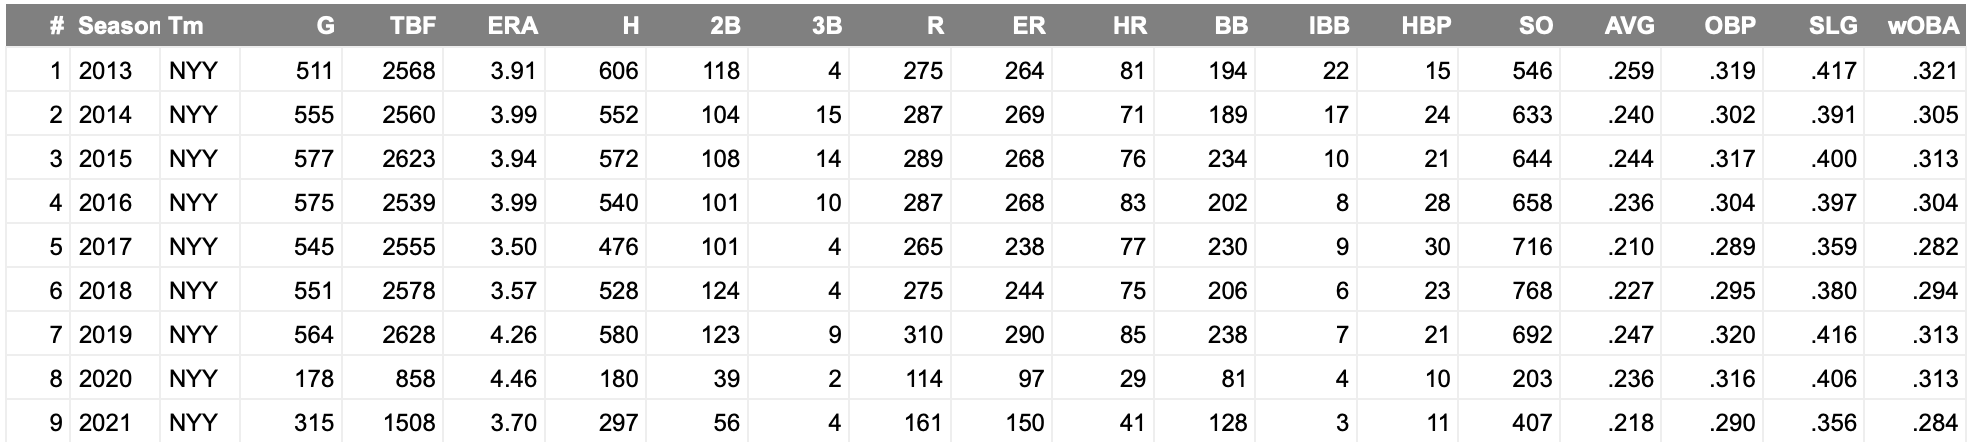
Pitching
On the pitching side, things are actually going pretty well. Batting average for opponents against Yankees pitching is the lowest it’s been during this period at .226. And the 3.78 ERA is significantly better than 4.31 and 4.35 in 2019 and 2020, respectively.
And while their best relievers have all had massive meltdowns over the past few weeks, their ERA from the sixth inning onwards is third-best during this span.
All in all, these numbers are not great signs of things to come. Then again, we’re not even into August yet, and again they are only two games back in the loss column in the Wild Card. The trade deadline is coming up fast, tomorrow at 4 p.m. ET. So far, the Yankees have been quiet outside of trading Luis Cessa and Justin Wilson to the Reds, although a trade for Joey Gallo is pending. They will need to make more moves to boost the team, otherwise, they could be looking at a similar fate to 2013, 2014, and 2016.