Early in the season, Jonathan Holder was the biggest issue in the Yankees bullpen. In his first three outings, he pitched to the following line: 2.2 IP, 7 R, 20.25 ERA, 3.00 WHIP. That is…not good.
In a long bullpen piece, I made an insulting flowchart about Holder and strongly criticized Aaron Boone’s usage of Holder. Well, it turns out I was wrong. Very wrong.
Holder was sent down on April 7, and since being recalled on April 21, he literally has not allowed an earned run. That’s right, in his last 22 – 22! – outings, Holder has not allowed an earned run. He has lowered his ERA all the way to 1.84 and has emerged as a legit bullpen ace. He’s even succeeded in multi-inning outings – his last two appearances were each 2.1 innings long and both were spotless outings with 2 strikeouts each.
So short of selling his soul to the devil, how on earth has Holder been doing this?
Trouble with the Curve
Holder was known for his curveball, in large part because of its high spin rate. Even this season, his curve has the 18th highest spin rate in baseball at an average of 2858 RPM. To give you an idea, that is 9 RPM higher than Justin Verlander’s vaunted curveball. However, this season the curve was not an effective pitch. With just 19 instances of being thrown, the curve has registered a pitch value of -0.4 according to Fangraphs.
Slip ‘n’ Slide
While in the minors this season, Holder worked on refining his breaking pitch to turn it into more of a slider. In a post-game interview with YES, Aaron Boone said “he’s relied more on the slider, as opposed to the curveball earlier in the year and that’s become a real weapon for him.” And in this chart from Brooks Baseball, you can see the clear uptick in slider usage at the expense of the curve as the season has gone on.
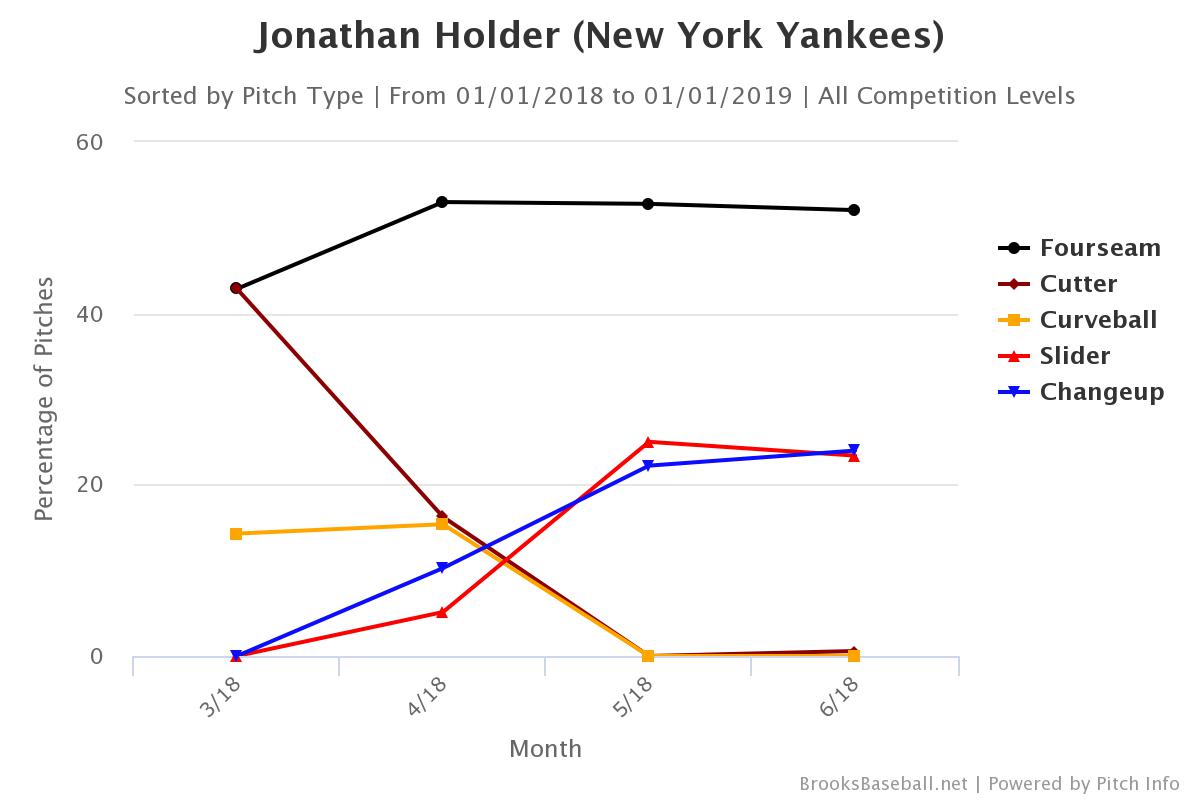
The other adjustment is also clear: Holder has stopped throwing his cutter and has instead increased his 4-seam and changeup usage. He has basically completely changed his pitch usage to great effect.
How has it worked?
Let’s take a look at some pitch location charts to understand how Holder has been approaching hitters. First, is the location chart from early in the season, before Holder was sent down.
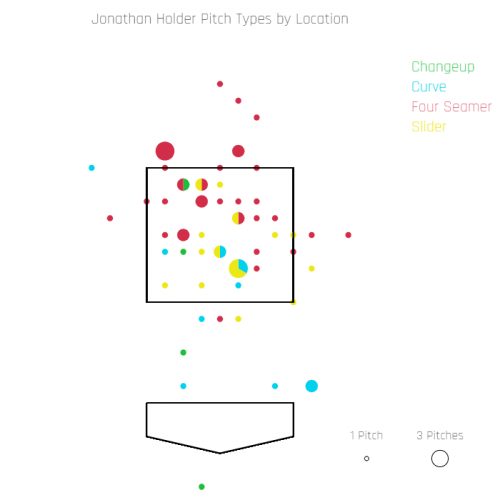
The bigger the circle, the more pitches in that location. As you can see, Holder threw A LOT of pitches right over the heart of the plate and his off-speed pitch location was especially poor. The largest concentration of curveballs were so far out of the zone that batters can easily lay off it. Also look how bad the location is on the few sliders that Holder threw in this time frame – basically all were right in the middle of the plate! Now let’s take a look at the post-send down chart:

This one is much, much better. A few things stick out in this plot:
1. Fastballs up, sliders down. The slider location in this chart is fantastic and located down and away to a right-handed hitter. The fastballs up are also good bets to get swings and misses.
2. Increase in changeups. In the first chart, there was maybe one changeup. Now, you can see consistent usage AND consistent location away to a left or in on a righty which is where you want it.
3. Lack of curveballs. There are very few curves in this chart, and the ones that were thrown were mostly a little below the zone which is a stark improvement.
We can clearly see how the pitch mix change has let to greater results in this next graph:
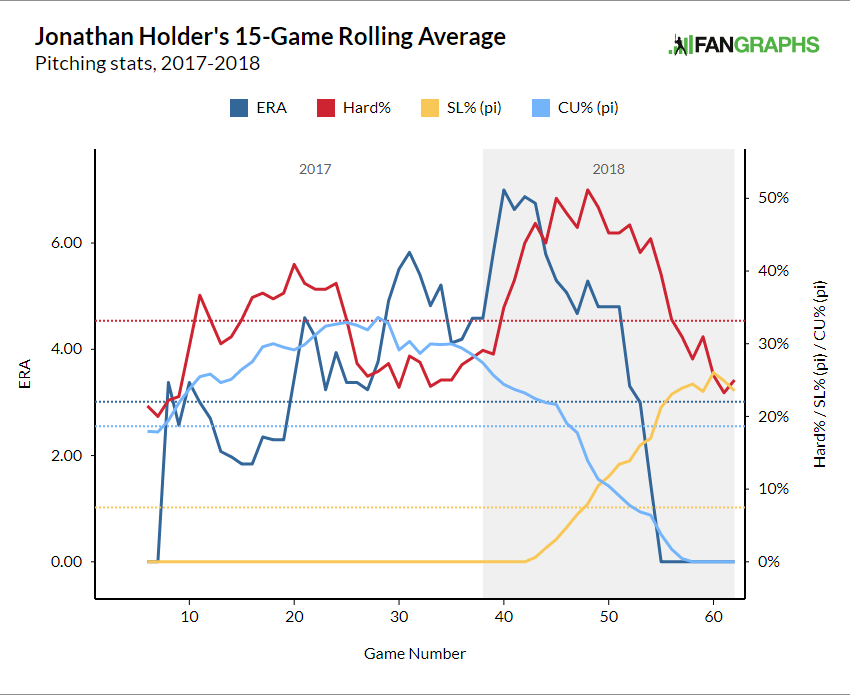
This chart shows 15-game rolling averages to get a sense of short term improvements. This season, as Holder has thrown fewer curves and more sliders, his ERA and hard hit % have both dropped. In fact, the point in which the 15 game average of sliders was greater than the average of curves is like an inflection point for when Holder’s results drastically improved.
Why is this working?
Pitch location is definitely one factor, but other than that I am not sure. My best guess is that Holder’s new pitch mix tunnels better than his old one. Basically, tunneling refers to how long two different pitch types look the same before they leave the “tunnel” and break. Pitches that tunnel better with each other are likely to be more effective because batters have a harder time determining which pitch is coming and have less time to react.
For example, here is a GIF of Corey Kluber’s pitches that shows how well they tunnel together:
Corey Kluber, 94mph back door Two Seamer (outside corner/foul) & 86mph Slider (Swing and Miss), Overlay.
Good illustration of how Kluber gets hitters to fish off the plate/tunnel. pic.twitter.com/hrV2KgNoee
— Rob Friedman (@PitchingNinja) June 6, 2018
For Holder, his curveball may have been too loopy and risen before it dropped, which would make it clear that it was coming. My guess is that Holder’s slider looks more similar to his fastball out of his hand so hitters have trouble picking it up. Here is a GIF of the curve in which you can see the hump before the drop:
And here is the slider which does not have that same upward path immediately after release:
Unfortunately we do not have great tunneling metrics so it is difficult to verify if this is the case but regardless, Holder has changed how he pitches and he, the Yankees, and we are all reaping the benefits.
You can contact Rohan on Twitter @rohanarcot20